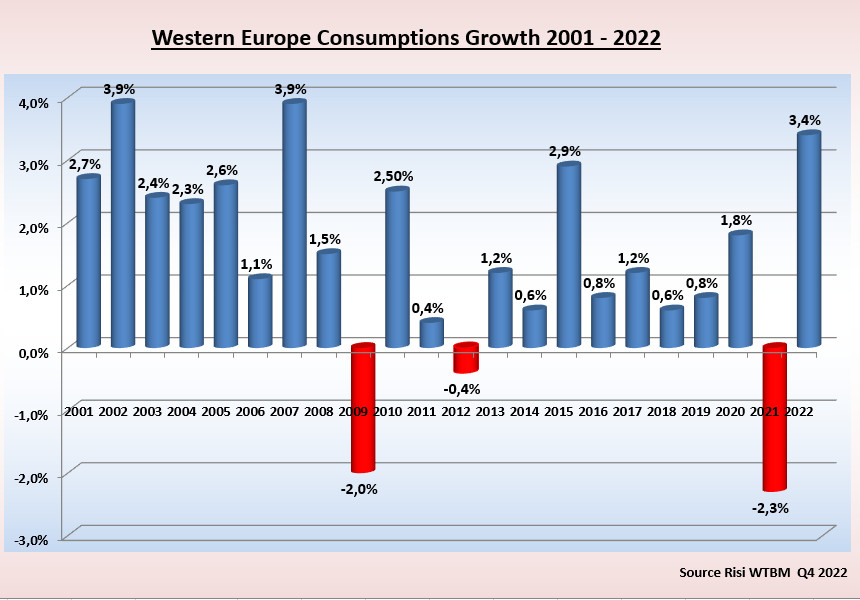
After a decline in 2009, Western Europe Tissue Consumptions grew significantly in 2010, slightly in 2011 and were about flat in 2012. In 2013 the growth was 1,2%, in 2014 it was 0.6% and in 2015 a very healthy 2,9%. Then years with a modest Consumptions Growth in Western Europe have followed: 0,8% in 2016, 1,2% in 2017, 0,6% in 2018 and 0,8% in 2019. After the Covid-19 pandemic consumptions grew 1,8% in 2020, followed by a sharp decline (2,3%) in 2021. In 2022 a relevant growth of 3,4% appears to emerge from the available data, but the comparison with 2020 indicates only a 0,9% growth. This can be observed in the first graph, linked here below.
This is the Western Europe Tissue Consumptions growth by year for the over 20 years period 2001 – 2022:

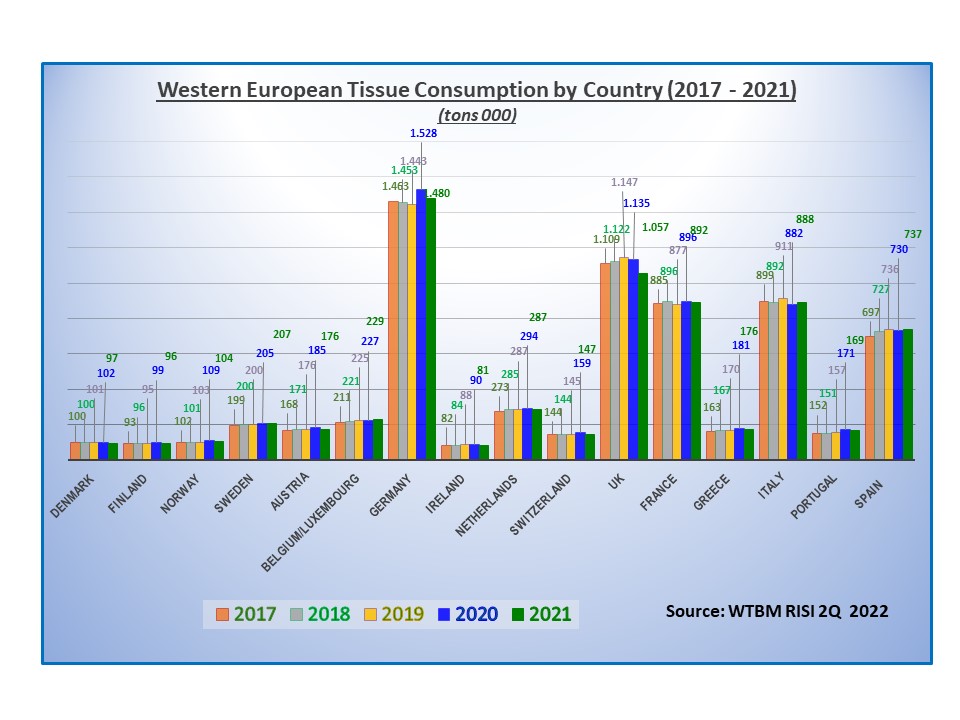
- These are the data of Western Europe Consumptions by market in the last years (data up to 2021, source WTBM 2Q 2022):

Following are the Global Tissue market growth data by year for the period 1998 – 2021:
In the following links you will find:
- World Tissue Consumptions by Region 2020 (updated Q2 2022)
.
- Regional Consumption of Tissue, 1994-2019 (actual data + expected)
In the next chart you can find the forecasted global growth rate for the years 2019 – 2031
=======================================================================
Past data:
Read more on RISI World Tissue Business Monitor


